


Izdvajamo


New Products
-
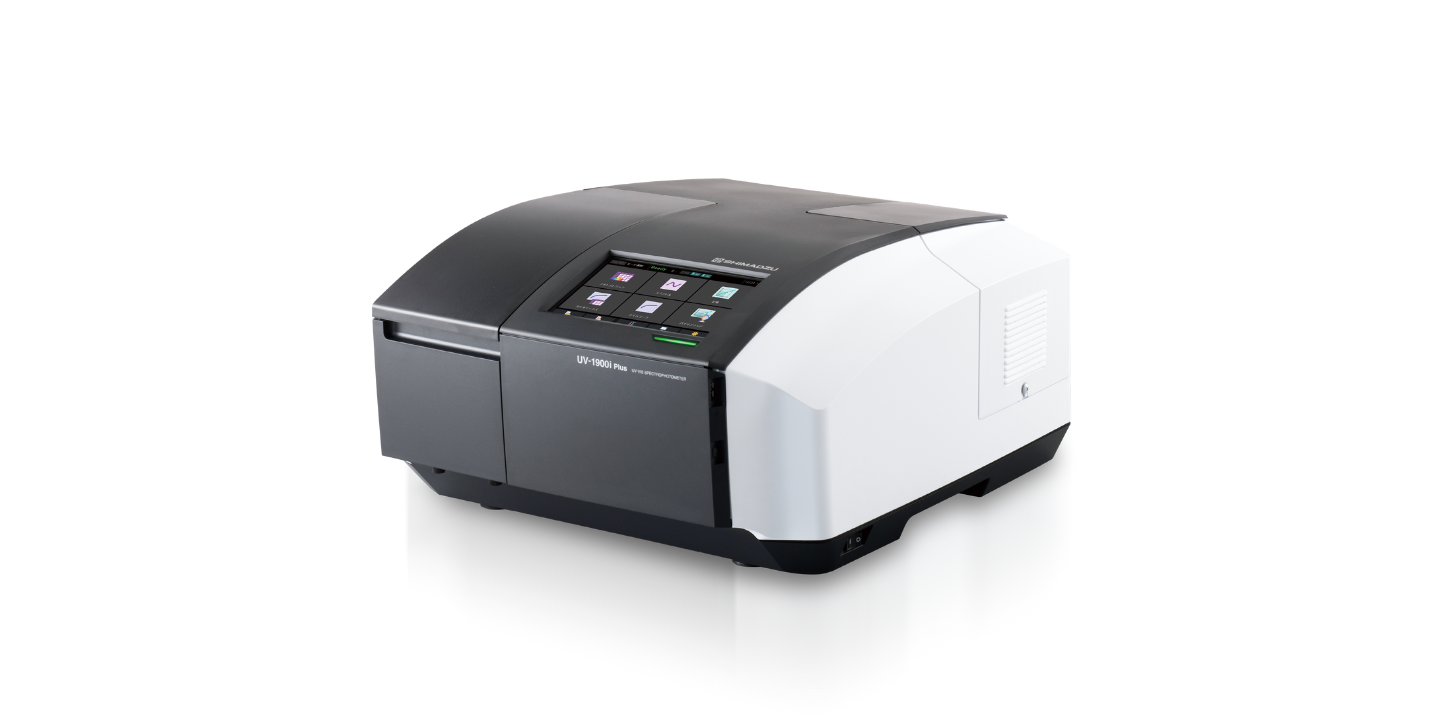
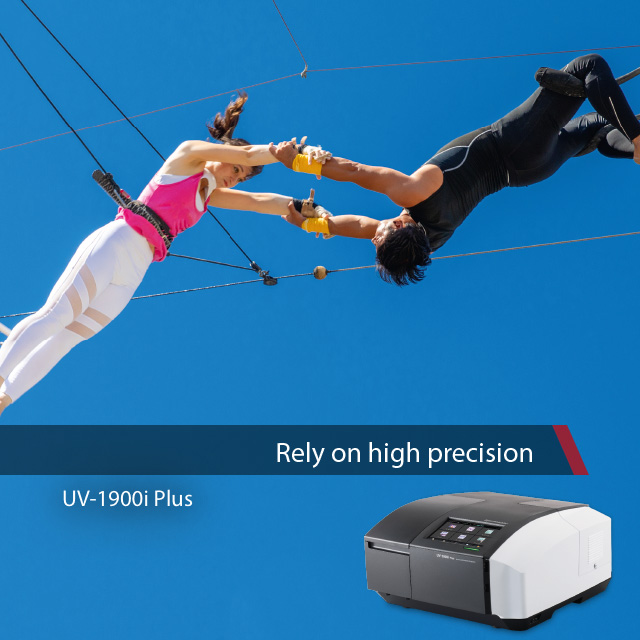
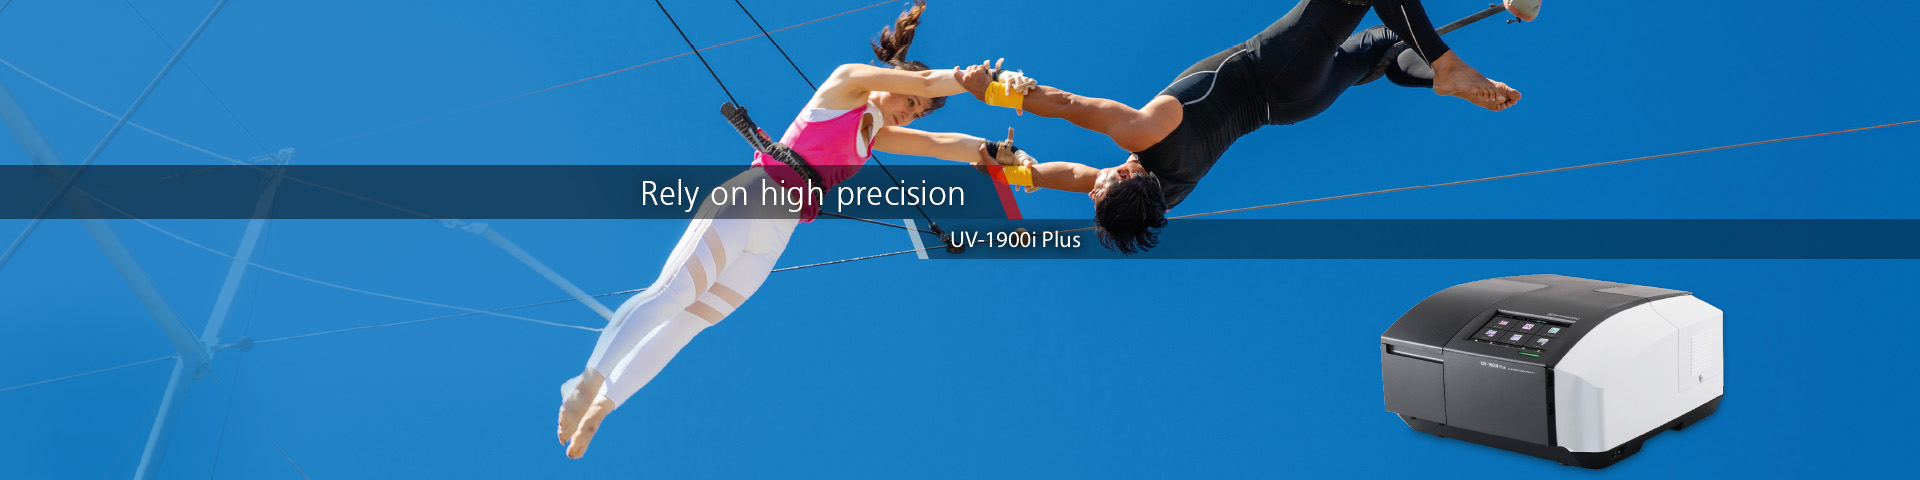
UV-1900i Plus
Experience unmatched precision and ease with UV-1900i Plus.
Featuring a refined user-friendly interface, ultra high-speed scanning, and comprehensive support functions, UV-1900i Plus ensures accurate and efficient measurements for all your needs. -
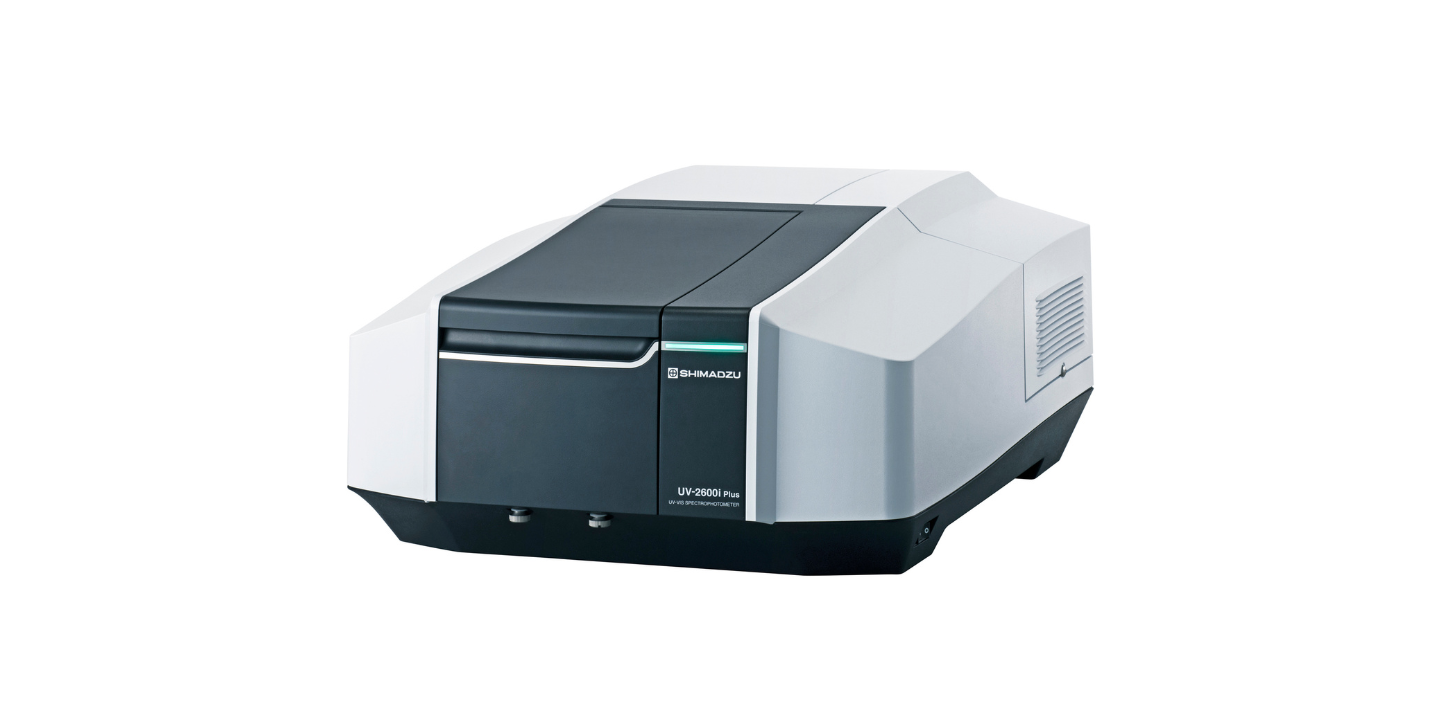
UV-2600i Plus/UV-2700i Plus
Accommodating a wide range of accessories, UV-2600i Plus/UV-2700i Plus excels in diverse applications, measures slight absorbance differences, and ensures robust data management and compliance.
-

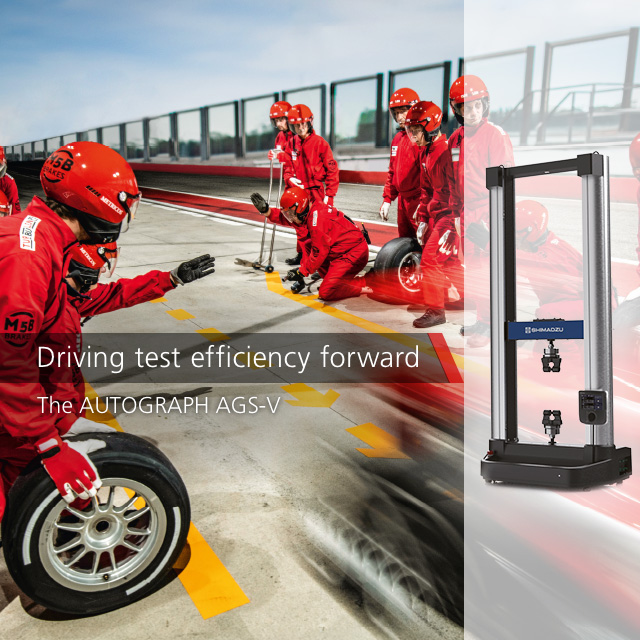
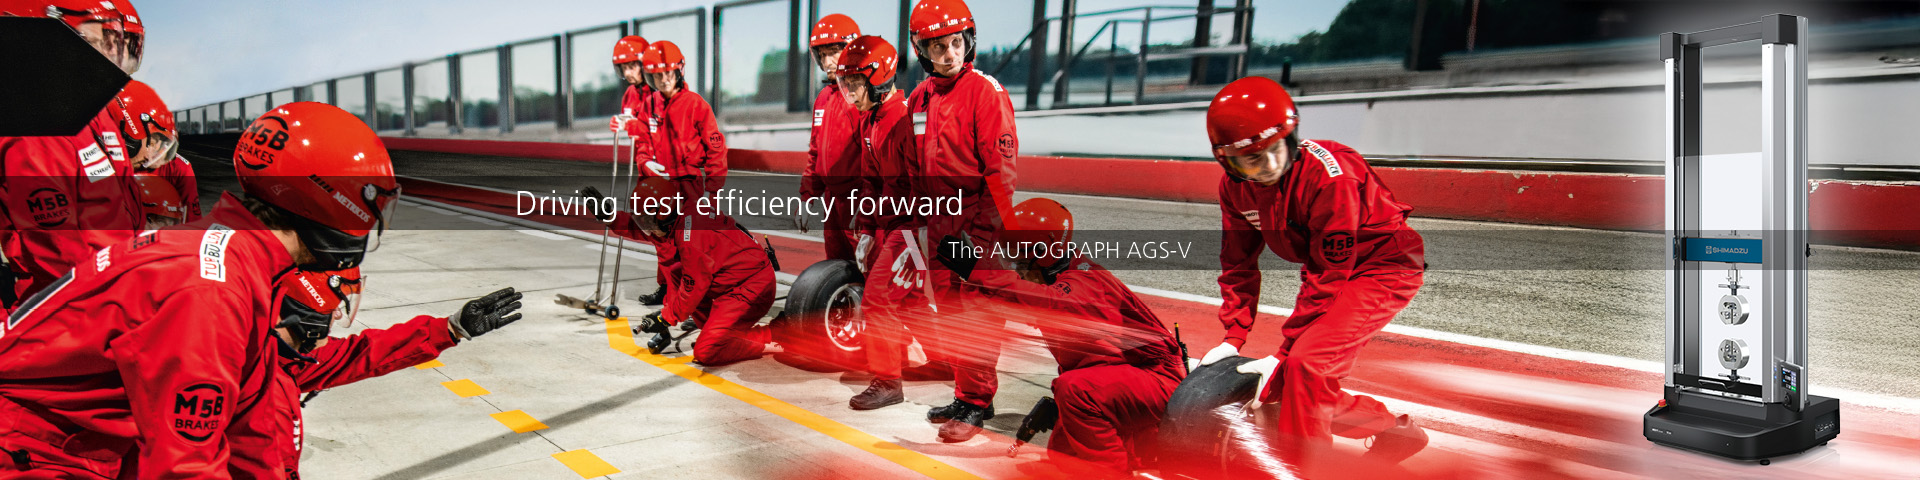
AUTOGRAPH AGS-V Series
In this series, the range over which the force measurement accuracy is guaranteed has been increased by a factor of two compared with existing machines. As a result of this new function, the work required to change force measurement sensors and accessories required for measurement can be reduced.
-
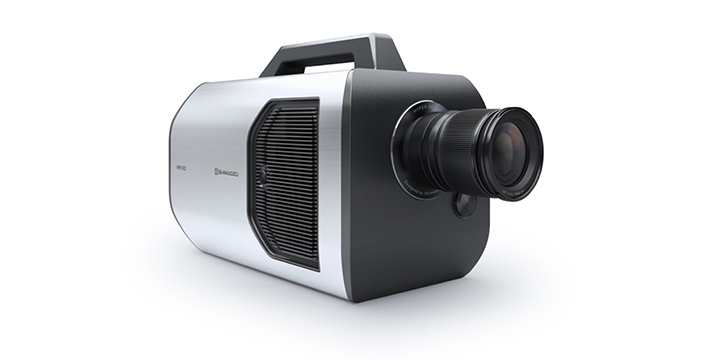
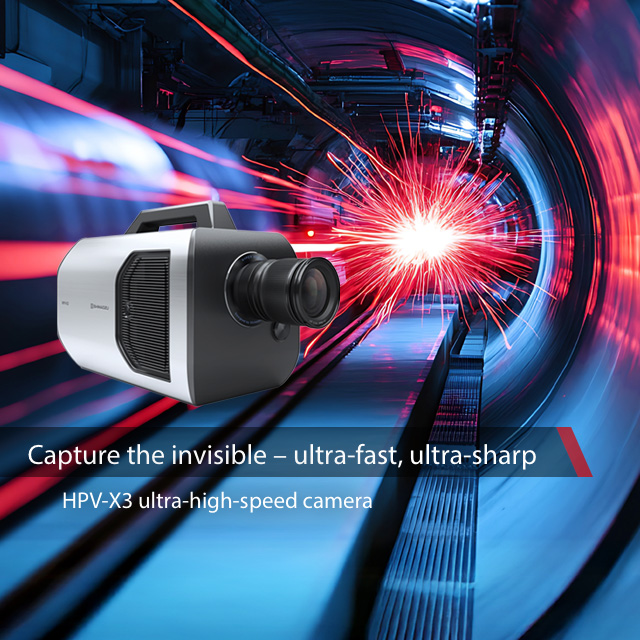
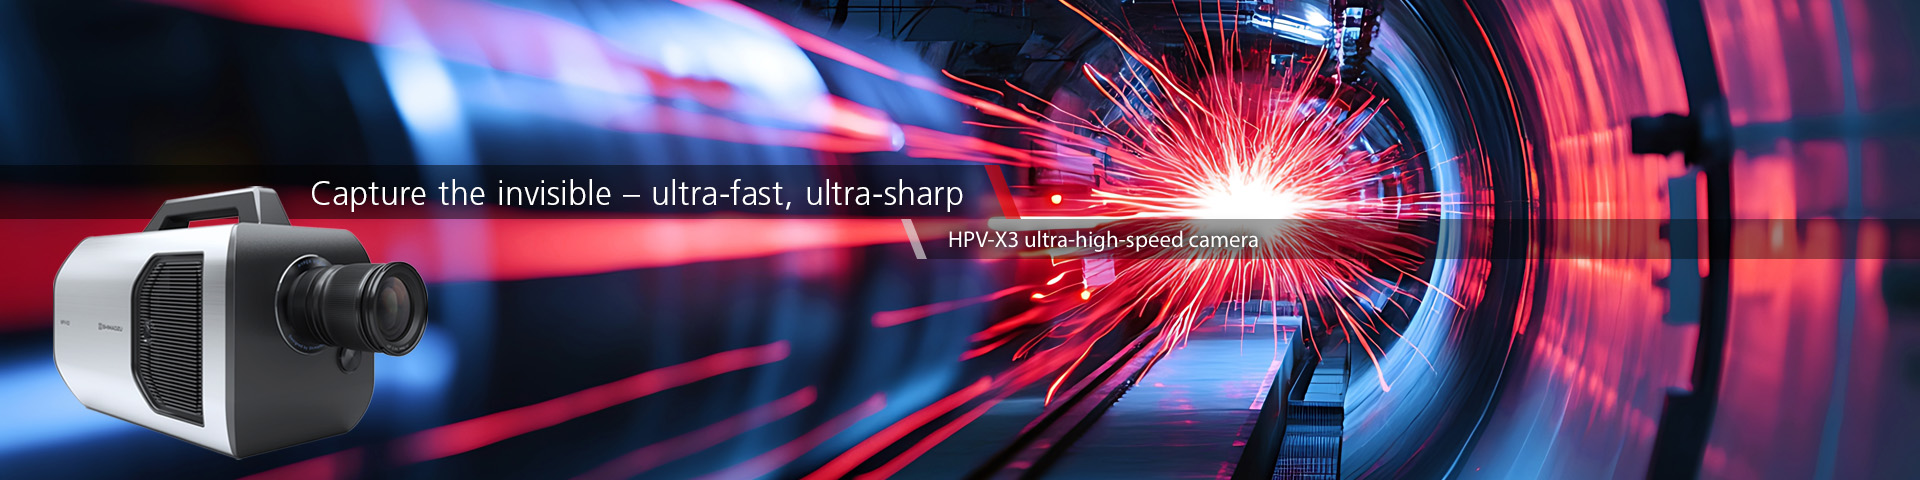
HyperVision HPV-X3
Recording speed of 20 million frames/second, the highest in its class provides larger, clearer, high-sensitivity recording. It is equipped with a synchronized recording function and high-level analytical capabilities that accommodate a variety of software programs.
-
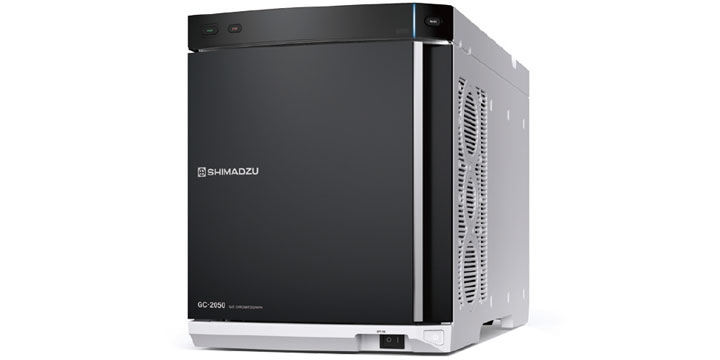
Brevis™ GC-2050
The Gas Chromatograph Brevis GC-2050 has been fully updated, -compact, powerful, and cost-efficient- crafted to elevate your productivity to unprecedented levels.
-
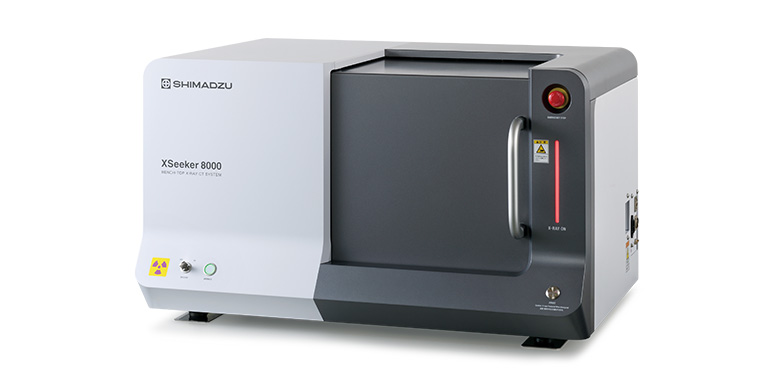
XSeeker 8000
The XSeeker 8000 bench-top X-ray computed tomography (CT) system is equipped with a high-output X-ray generator and a high-resolution flat panel detector. Despite its compact size, it has a high X-ray output of 160 kV, enabling clear observations of molded plastic parts as well as aluminum die cast parts and other metal parts.