LabSolutions CS - Značajke
Analysis Data System
Comfortable Operating Environment
LC and GC Systems Can Be Controlled from One Software
With LabSolutions, both LC and GC systems are operated from One software, enabling simultaneous control of multiple instruments from a single PC. The LC and GC instruments connected can be used in a flexible manner by switching between them. The shared LC and GC analysis operating environment, which inherits the operability of LCsolution and GCsolution, lessens the training time for workstation operations.

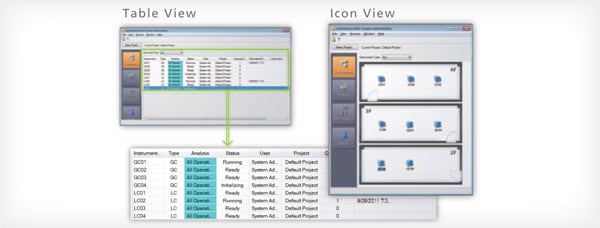
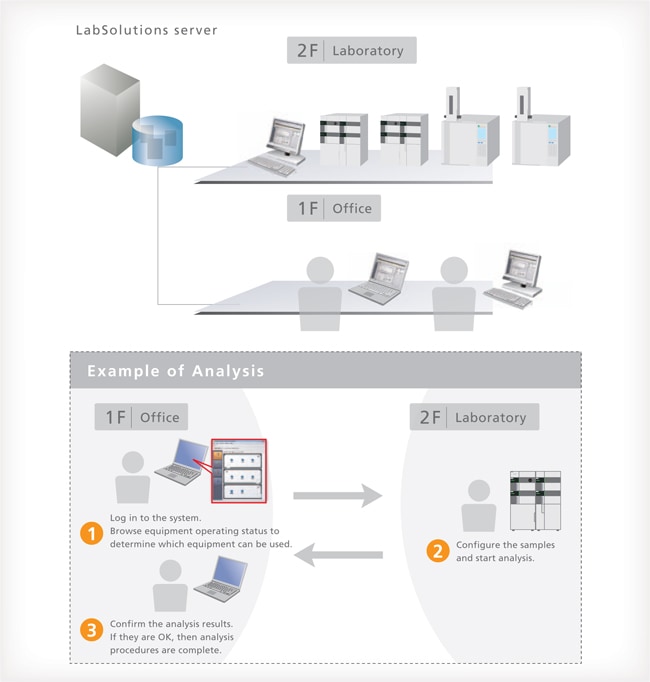
Check Equipment Operating Status at a Glance
The LabSolutions operating monitor enables confirming the operating status of connected instruments, and the estimated analysis completion time for each instrument. Operating status can be assessed at a glance even when multiple instruments are operating at the same time. This is helpful for scheduling analysis procedures to match equipment availability. In addition, equipment icons are displayed to match the grouping or location of instruments in a laboratory.
Control and Analysis are Possible from PCs Other than the Analysis PC
With LabSolutions CS, equipment can be accessed freely, from any location, while maintaining security. For example, before starting an analysis, the equipment can be operated from a PC in the laboratory. After analysis starts, a PC in the office can be used to confirm operating status, control the equipment, and analyze the data. This improves the efficiency of analysis status monitoring, equipment control, report creation and other procedures.

An Enormous Quantity of Data Can Be Quickly Searched
LabSolutions CS provides integrated, server-based data management, which means that data can be browsed from anywhere. In addition, the data obtained from the analysis schedule can be looked for collectively and a wealth of search functions makes it easy to search for data of interest.
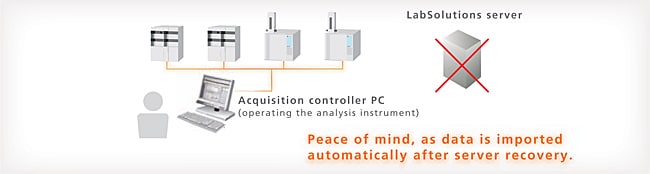
Capable of Analysis Even When the Server is Down (LC, GC)
With general systems, when the server is down, analysis stops. With LabSolutions CS, even if a problem with the server occurs, analysis can be performed using the acquisition controller PC. In addition, after server recovery, the data from analysis results is saved automatically in the LabSolutions server via the acquisition controller PC.
Safe and Secure Data Management
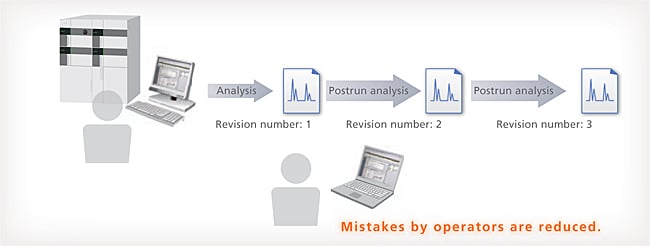
Database Management Prevents Mistakes
With LabSolutions DB and CS, the analysis data is managed securely by the database. Overwriting, deletion and other mistakes typical of data file management do not occur. In addition, when postrun analysis is performed using the acquired data, postrun analysis data revision numbers are automatically assigned, preventing the accidental overwriting of raw data. It is easy to display earlier data.
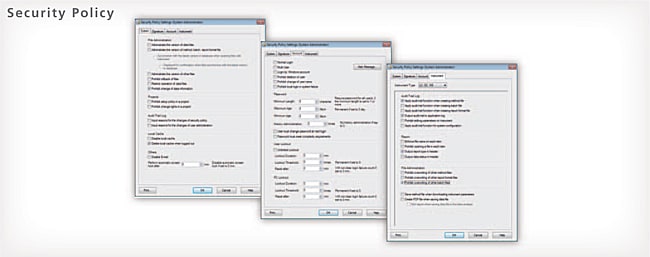
Solid Security
An audit trail to ensure the reliability of data and document e-mail transmission functions when any event occurs in the system can be set up. User accounts are managed using passwords, where password length, complexity and term of validity must satisfy specified requirements. It is also possible to set lockout functions to prevent illegal access, and set a registered user’s deletion and change. In addition, a box can be selected to prevent overwriting a data file, and outputting an item to a report can also be performed.
Control and Analysis are Possible from PCs Other than the Analysis PC
With LabSolutions CS, equipment can be accessed freely, from any location, while maintaining security. For example, before starting an analysis, the equipment can be operated from a PC in the laboratory. After analysis starts, a PC in the office can be used to confirm operating status, control the equipment, and analyze the data. This improves the efficiency of analysis status monitoring, equipment control, report creation and other procedures.
Improving Managerial Efficiency
System Information, Including Data and Users, is Integrated with a Server
Currently, since user information is managed for every PC, as the number of PCs managed increases, so too does the burden on the administrator. LabSolutions CS provides integrated server-based management of user information, so user management is not required individually for each PC and the administrator’s time and effort is reduced.
Data backup is also important. Since the data can be managed with a server, data does not remain in each PC. It can be stored on the server or saved to media such as a USB HDD. The data can be referred to directly, without returning to the original database. (Restoration unnecessary) In addition, if tape library equipment is used, it can overcome server trouble etc., thereby achieving even more efficient management.

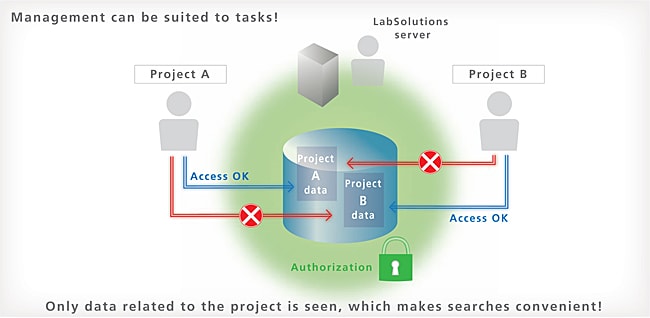
Pertinent Information is Managed for Every Project
LabSolutions DB and CS provide a project management function enabling management suited to tasks and system operations. This function enables equipment and user management, security policy, and data processing to be set on a project by project basis, thereby improving the efficiency of data searches and management tasks.
Total Support for Regulatory Compliance
Support Functionality for CSV (IQOQ Validation)
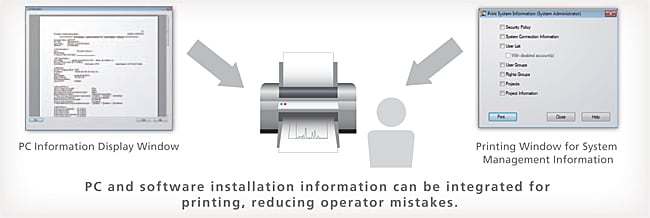
With conventional LCsolution/GCsolution software, CSV procedures involve confirmation and transcription of OS versions and software settings across multiple windows. With LabSolutions, Windows OS security patches and other PC and software installation information is integrated for display, and can be printed. In addition, LabSolutions security policy, numerical rounding settings, and other system
information, as well as user information and equipment information, can be integrated for printing from a single window. As a result, operators can confirm this information without opening a number of settings windows. This reduces operator mistakes and improves efficiency.
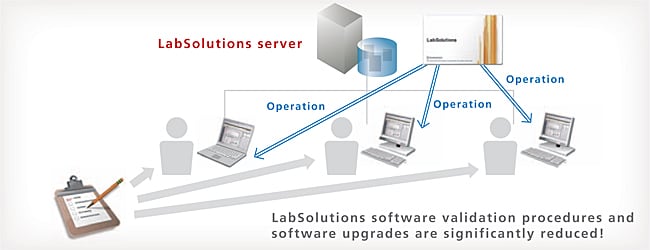
Configuration Management of Client PC LabSolutions Software Not Required
LabSolutions CS is compatible with the Windows terminal service (RemoteApp). Since LabSolutions software is not installed on a client PC, validation procedures and software upgrades for client PCs are significantly reduced. The terminal service function enables remote use of LabSolutions software installed on the server. The server-based LabSolutions software can be operated with the usual degree of user friendliness as is.
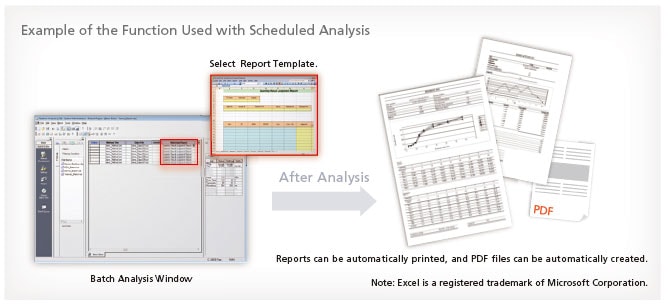
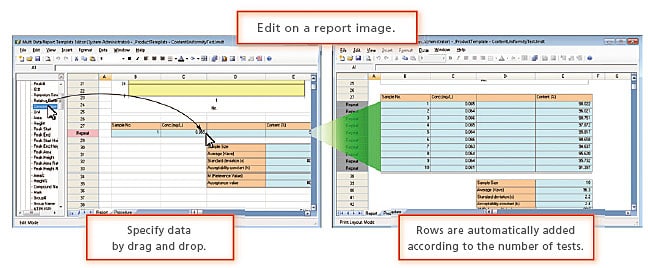
Multi-Data Report
In addition to the normal analysis report creation function, LabSolutions offers the multi-data report creation function that allows the user to prepare reports with combined data from various instruments. It provides report templates for system conformance, content uniformity, elution, and other standard tests as standard. The operational environment is the same as for Excel, making it easy to prepare report formats for various standard tests. In addition, this function supports automatic report printing and automatic generation of PDF files.
Features simplified preparation of free formats and a reduced validation workload using change control.
Allows the user to:
- Save time and effort when creating simple templates and using Excel.
- Print out reports for various instruments using LabSolutions only.
- Create report templates for various standard tests with ease.
Enabling Report Creation for Various Instruments
LabSolutions' Data Manager can prepare integrated reports using analysis data and results obtained from various instruments. Not only can reports be created for HPLC, GC, MS, FTIR, UV, balances, and other instruments individually, but they can include combined data from several instruments.
Enables automatic printing of prepared reports and automatic generation of PDF files.
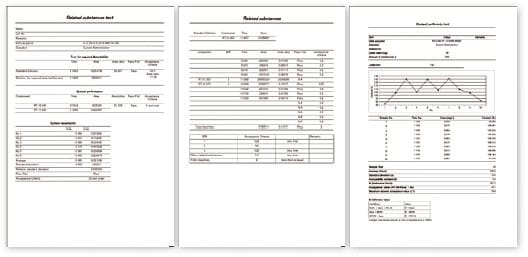
Report Templates for Various Standard Tests Provided as Standard
Verified templates for system conformance, content uniformity, elution, purity (structural analogs), and other standard tests are provided as standard. Also, free templates can be easily customized.
Peak Integration Algorithm
The time required to analyze large quantities of data obtained from the increasingly quick analyses and increasingly prevalent simultaneous multicomponent analyses in recent years has become a challenging issue. In addition, the strengthening of regulations associated with data integrity has given rise to demands for automated and simplified manual methods for integrating the areas of problematic chromatogram peaks. Herein, we introduce a new peak integration algorithm for LabSolutions, i-PeakFinder, which is designed to resolve these issues. i-PeakFinder, a new peak integration algorithm for LabSolutions, is a completely automated integration function that can detect peaks with high levels of accuracy without requiring special parameter adjustments. In addition, this algorithm has adjustable parameters that allow the integration function to be applied to a wide range of complex chromatogram patterns. Furthermore, the adjustable parameters allow to output highly accurate peak integration results from large quantities of data, even for batch analysis.
Features of i-PeakFinder
With Shimadzu's traditional peak integration methods or competitor methods, some complex chromatograms require time programming in addition to the typical parameter adjustments for peak integration. However, i-PeakFinder can perform peak integration of these chromatograms just with simple parameter adjustments. This peak integration function has the following features:
- Highly accurate detection of shoulder peaks
- Simple adjustment of peak-baseline processing
- Improved peak-baseline positioning that results in improved reproducibility
- Performing accurate peak integration even with variabilities caused by baseline drift
Shimadzu also emphasizes on compatibility, so LabSolutions can also be used with the traditional peak integration methods (Chromatopac mode). Switching between the traditional peak integration and i-PeakFinder methods during analysis is easy, allowing the user to select an appropriate peak integration method for the circumstances. This includes selecting a traditional method for compatibility with past data. Fig. 1 shows examples of using the completely automated integration function to analyze typical peaks.
Highly Accurate Detection of Shoulder Peaks
i-PeakFinder can accurately detect shoulder peaks. In cases wherein manual peak integration is required to distinguish and detect the shoul-der and main peaks using traditional peak integration methods, i-Peak-Finder can automatically detect shoulder peaks while maintaining consistent peak detection sensitivity throughout the entire chromatogram. In general, it is difficult to automatically detect considerably small shoulder peaks, as shown in Fig. 2; however, i-PeakFinder can even detect such peaks automatically based on the threshold judgment.
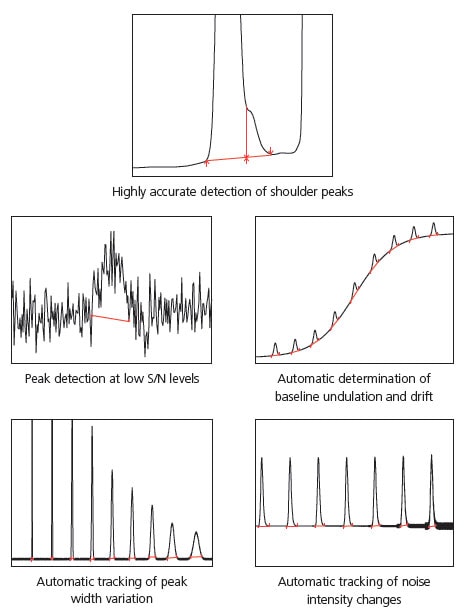
Fig. 1 i-PeakFinder's Completely Automated Integration Function
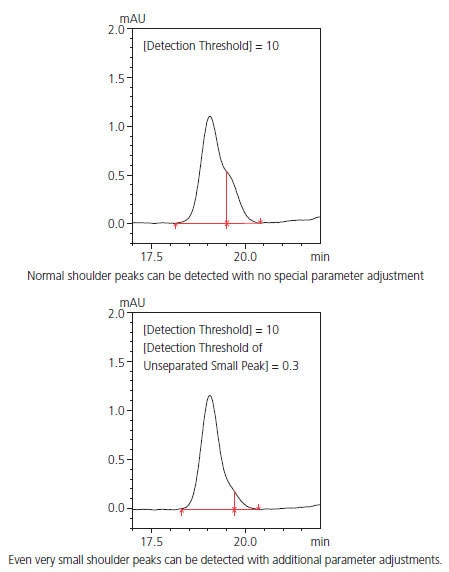
Fig. 2 Examples of Shoulder Peak Detection
Simple Adjustment of Peak-baseline Processing
Accurate detection of impurity peaks is essential for pharmaceutical quality control and other applications. Impurity peaks are often fused at the base of a major peak, and quantitative results obtained via area normalization can vary depending on the method used for peak-baseline processing. The method used for peak-baseline processing also differs based on the samples and testing objectives. With traditional methods, performing a specific type of peak-baseline processing requires the user to include time programming or perform peak integration manually.
However, i-PeakFinder has adjustable parameters in its basic settings for performing a specific type of peak-baseline processing, allowing the user to easily implement the optimum peak-baseline type in each situation. Fig. 3 shows a list of peak-baseline type in the settings window, Fig. 4 shows the result of peak-baseline type setting of an impurity peak that is fused at the base of a major peak, and Table 1 summarizes the quantitative results obtained via area normalization with different peak-baseline type settings. Peak-baseline processing appropriate for a particular situation can be simply performed by changing a few basic parameters.
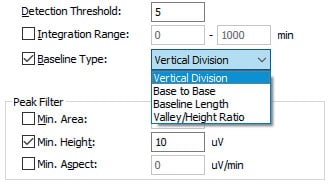
Fig. 3 Peak-baseline Type Settings
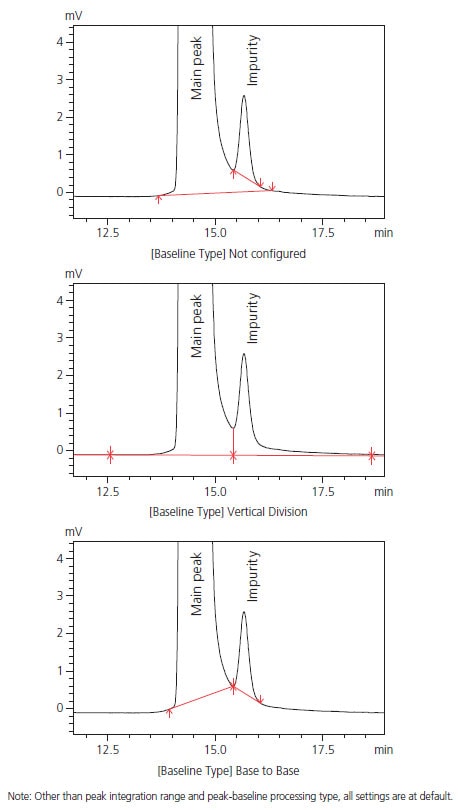
Fig. 4 Peak-baseline Processing Example
Table 1: Quantitative Results Obtained via Area Normalization with Different Methods of Peak-baseline Type
| Not configured | Vertical Division | Base to Base | |
|---|---|---|---|
| Main peak | 99.681 | 99.448 | 99.680 |
| Impurity | 0.160 | 0.338 | 0.160 |
Basic Peak Detection Parameters
The basic parameters that allow the user to adjust peak detection conditions are the peak-baseline type mentioned above, peak detection threshold, and peak integration range. Using the detection threshold setting, the peaks below a certain threshold are not detected based on the estimated noise level calculated using a proprietary algorithm. Decreasing the peak detection threshold value allows the detection of smaller peaks. The peak integration range specifies the time range during which peaks will be detected. Fig. 6 shows the change in results produced by changing the peak detection threshold from the default setting of 5 to 2,000. These intuitive controls allow the user to detect or not to detect small peaks with a simple adjustment. Fig. 7 shows an example of adjusting the peak integration range. Without adjusting the peak integration range, all peaks fall within the range and the peak-baseline is affected by negative peaks. Setting the peak integration range to exclude negative peaks allows the user to configure an appropriate baseline.
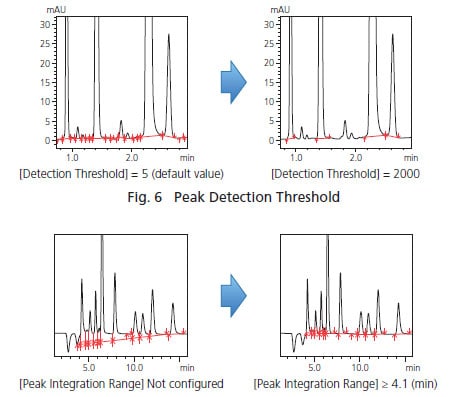
Fig. 7 Peak Integration Range
Detailed Peak Detection Settings
For complex chromatograms, adjustments of the detection threshold, peak integration range, and peak-baseline type may not be enough to obtain the desired peak integration results. i-PeakFinder is compatible with a wide variety of chromatograms and allows the user to configure more detailed peak detection conditions. Some of these detailed settings are described below:
(1) To Detect Peaks Not Affected by Noise [Minimum Half Width]
Smoothing is sometimes performed on chromatograms obtained via LCMS. If the noise frequency is close to the peak frequency, then it becomes difficult to determine peaks automatically and single peaks may be recognized as multiple peaks. In this situation, configuring the minimum half width setting ignores noise smaller than that value and ensures that peaks with a FWHM value above the set minimum value are detected among the peaks with a wide wave profile due to smoothing. Fig. 8 shows the difference made by increasing the minimum FWHM value. This feature is useful when noise can be observed in a peak.
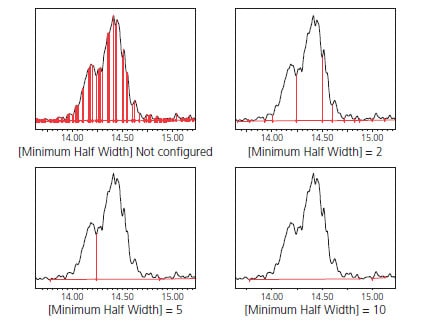
Fig. 8 Example Configuration of Minimum FWHM
(2) To Ensure Peak Area Accuracy and Linearity [Peak Baseline Height]
With tailing peaks and chromatograms with a large amount of baseline noise, the peak start and end points can vary depending on the data, which can reduce area accuracy. By using the peak-baseline height setting, the peak start and end points are recognized as the product of a value entered for peak-baseline height and noise intensity calculated using a proprietary algorithm. Consequently, the larger the peak-baseline height value is, the higher the peak-baseline is positioned.
Using this setting provides good reproducibility in the determination of peakbaseline start and end points. Fig. 9 shows an example configuration of peak-baseline height where the baseline length of the tailing peaks is adjusted by specifying the peak-baseline height.
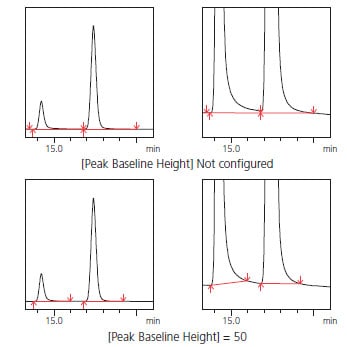
Fig. 9 Example Configuration of Peak-Baseline Height for Tailing Peaks
(3) To Avoid Recognizing Long-Period Undulations as Peaks [Maximum Half Width]
The maximum half width, which is the opposite of the minimum half width, is a parameter that can be specified to ignore larger peaks as baseline undulations. For example, Fig. 10 shows baseline drift appearing as a large baseline bulge that could be recognized as a peak. This undulation can be removed by specifying a maximum FWHM.
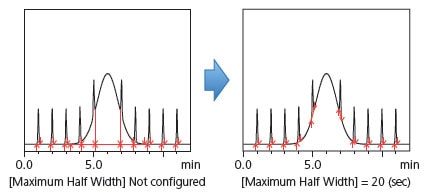
Fig. 10 Example Configuration of Maximum FWHM
(4) To Unify Fused Peaks into a Single Peak [Unify Peaks by Separation Width]
The minimum half width setting is used to avoid mistakenly recognizing noise as peaks, while the unify peaks by separation factor setting is used to combine fused peaks into a single peak. Fig. 11 shows three fused peaks. Configuring this setting will unify the two side peaks into the larger peak. Note that this setting is only effective for baseline intervals containing fused peaks.
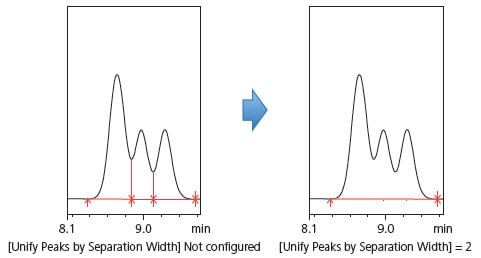
Fig. 11 Example of Unifying Unresolved Peaks
(5) To Decide Whether to Recognize Shoulder Peaks [Unify Peaks by Shoulder Ratio]
When impurities were fused as shoulder peaks at the base of a main component peak, the traditional peak integration method required time programming or manual peak integration to detect the shoulder peak. i-PeakFinder allows easy detection of shoulder peaks and also allows the user to decide whether to recognize (or not) impurity peaks based on a threshold ratio of the main component peak height to the shoulder peak tangential height. Fig. 12 shows an example of shoulder peak detection implemented without time programming or manual peak integration and an example of using the threshold value to unify the shoulder peak with the main component peak. Configuring a threshold value can also be used as a condition for deciding whether to recognize impurity peaks.
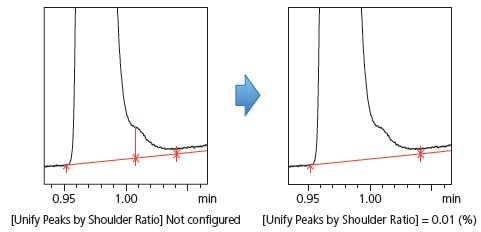
Fig. 12 Example of Setting a Threshold for Recognizing Shoulder Peaks
Column Manager
Analytical column management tool
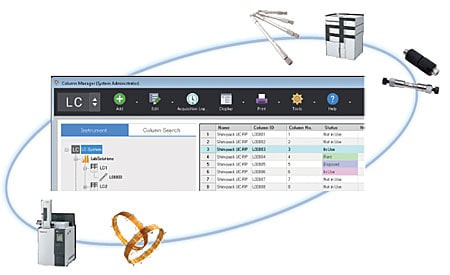
From the viewpoint of data integrity, management of columns used in analysis is required. LabSolutions column manager shows and prints the column information (contents concerning the column specification such as name, column ID, inner diameter, length etc.) used in LC / GC / LCMS analysis, the analysis result using the column, the total injection number and so on. It enables you to manage analytical columns.
Easy confirmation of usage and frequency in use of column
The column's final analysis date and time, the total injection count, the connection status with the instrument and so on are displayed, so you can easily check the usage and frequency of in use of column.
Easy confirmation of the analysis result using the column
Analysis results using columns can be displayed and printed as a list for each column. Display contents can be narrowed down by conditions such as device name and analysis date and time.
Audit trail of column management
Provides enhanced data integrity through an audit trail of column management, providing a record of the reasons for changing columns, and a setting to prohibit data acquisition when no column is set.
Easy management of column information
Column information already registered can be duplicated and registered, so you can efficiently manage columns.
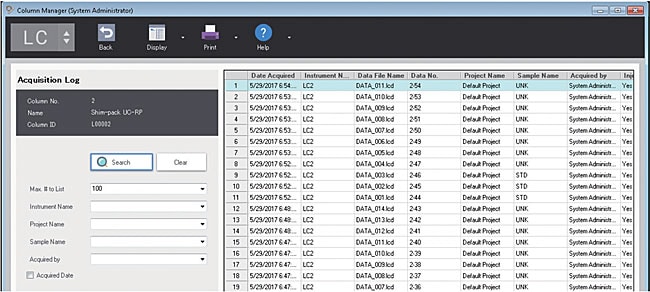
Confirmation of usage in use of column
In the column list view, you can check the usage status of columns registered in LabSolutions. In the list view, the information such as "Last Analysis Date and Time Using Column", "Final Analyst", "Total Column Injection Count", "Column Information", "Status" are displayed. In the instrument tree, you can also check the columns used in the instrument.
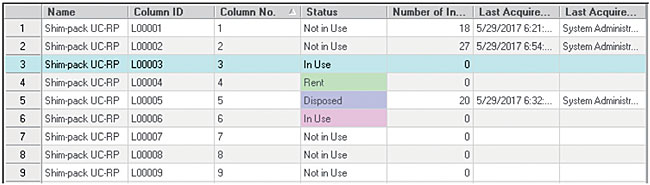
Column list view
Analysis history of column
You can display and confirm the history of analysis results performed on the selected column. The history of analysis results can be searched by instrument name, project name, sample name, analyst, and you can quickly check the history of analysis result.
Analysis history view
Operating environment
The following software is necessary for the operation of this software
LabSolutions DB / CS version 6.81 or later
Report Set
Strong Support for Ensuring the Reliability of Analysis Data and Enhancing Productivity
In analytical laboratories, it is necessary to ensure that there have been no errors or irregularities in the procedures used to obtain results from the acquired data. Confirming test results and maintaining accurate analysis operational logs are also required. This is in order to ensure both the accuracy of the acquired data and the reliability of analysis data.
LabSolutions Report Set visualizes software operations to ensure the reliability of analysis data. At the same time, the amount of time needed to confirm analysis results can be reduced to 1/2 or 1/3.
Three Features Achieved by the LabSolutions Report Set
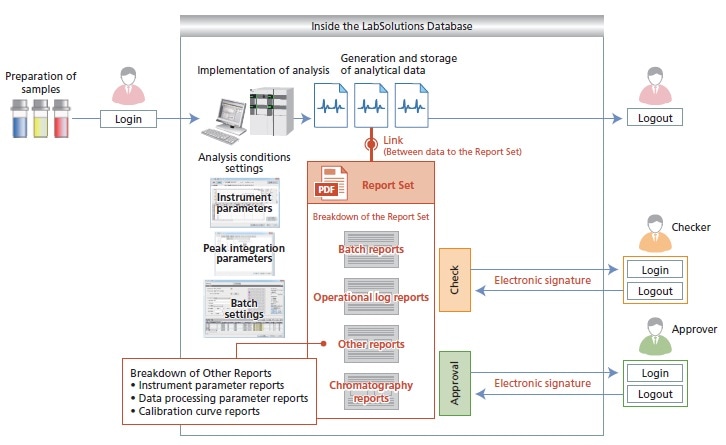
Visualization of the Sequence of Analysis Operations Ensures Reliability and Reduces the Burden of Confirmation Procedures

Information from a sequence of analyses (batch analysis), analysis results and conditions, and even the entire operational log from the start to the end of analysis procedures are summarized in a single PDF file (Report Set). This simplifies confirmation of analysis results and operations, thereby ensuring reliability and reducing the burden of confirmation procedures.
The Sequence of Analysis Results Is Automatically Protected Against Tampering
Editing of the sequence of analysis results subject to visualization is automatically disabled, preventing the revision, substitution, or tampering of results.
As a result, revision, substitution and other forms of tampering with the analysis results is prevented. In addition, the visualized Report Set and the sequence of analysis results are linked, allowing individual analysis results data sets to be searched and checked easily.
Digitization of the Confirmation Process for the Analysis Results Report Enhances Productivity

A report confirmation record can be left at any point in the analysis results report output as a PDF file. If any items have not been checked, an error is issued, preventing omissions in the report confirmation process. In addition, electronic signatures can be used for the confirmation of the Report Set. These functions simplify on-screen confirmation, enabling paperless operations and heightening productivity.
Provided Report Set Function Enables Visualization of Computer Operations and Improves Procedural Efficiency
For Creating a Report Set with LC/GC
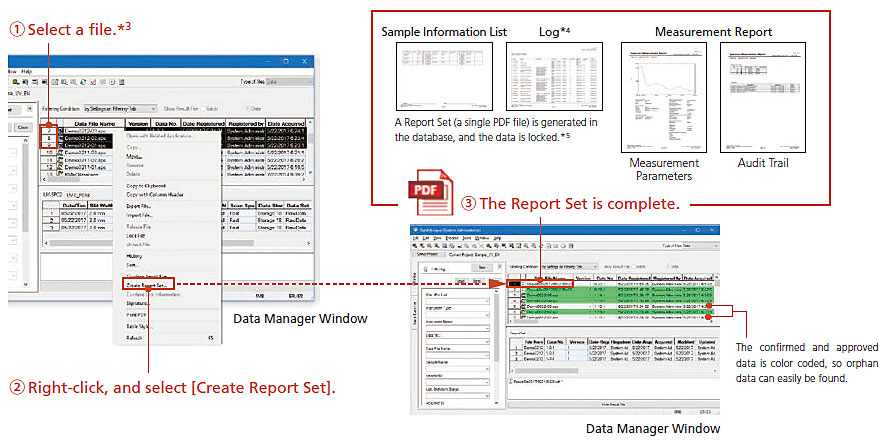
- Report Set is a PDF file that gathers operational information (human-mediated operations and settings) scattered within the software, as well as batch (sequential analysis) reports and chromatography reports, and summarizes them in a single report. This Report Set can be created with a single operation.
- As with analytical data and method files, the PDF Report Set is produced and stored in a security-controlled database. Also, the software that creates the PDF Report Set is incorporated in LabSolutions, so there is no need to apply separate validation for PDF creation software.
For Creating a Report Set*1*2 with Spectrometer
The procedures for creating a Report Set with a spectrometer follow the sequence for chromatographs, so the procedures are just as simple as with a chromatograph.
- *1: As of July 2017, the following functions (1) to (3) are not yet supported for UV, FTIR, and RF Report Sets.
(1) ID assignment to measurement methods
(2) Avoidance of duplicate printing of measurement methods for multiple data sets
(3) Sequential measurement. This is supported, however, for UV quantitative (photometric) analysis. - *2: UV, FTIR, and RF Report Sets are supported by the LabSolutions CS network and LabSolutions DB standalone.
- *3: In terms of file selection when creating report sets, for UV photometric data, if a single file is selected, a Report Set including any related files will be created.
- *4: A log is recorded during measurements. If a postrun analysis is performed, a log will also be recorded during the postrun analysis.
- *5: Locked files can only be unlocked by users with the relevant rights.
Controlling Agilent's HPLC and GC
It is now possible to control Agilent's HPLC and GC instruments from the LabSolutions DB/CS analysis data system. Each of the functions offered by LabSolutions DB/CS, such as integrated database management of analysis data and method information and access to analysis data from each client PC, can be used not only with Shimadzu's HPLC, GC, UV, and FTIR instruments, but also with Agilent's HPLC and GC instruments.
LabSolutions DB/CS employs the method editing window and analysis monitoring user-interface screens from Agilent's HPLC and GC driver packages integrated through the Agilent Instrument Control Framework (ICF).
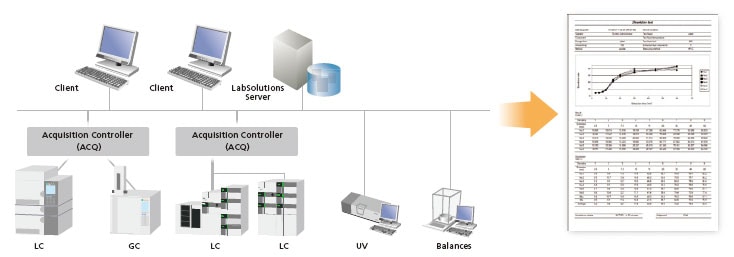
LabSolutions CS offers integrated database management of LC and GC data as well as data from other instruments used in a laboratory, including mass spectrometers, TOC analyzers, and balances, using a server computer database. In addition, allows creation of reports for various types of tests.
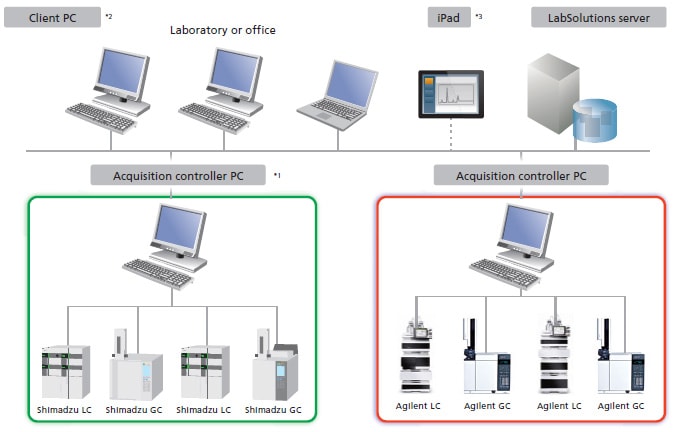
- The acquisition controller PC controls the analytical instruments.Analysis directions and re-analysis of data can be performed using a client PC.
- It is not necessary to install LabSolutions software on the client PC for terminal service.
- iPad is a registered trademark of Apple Inc.
- When using an iPad, the installation of Citrix’s XenApp is required. iPad is a registered trademark of Apple Inc.
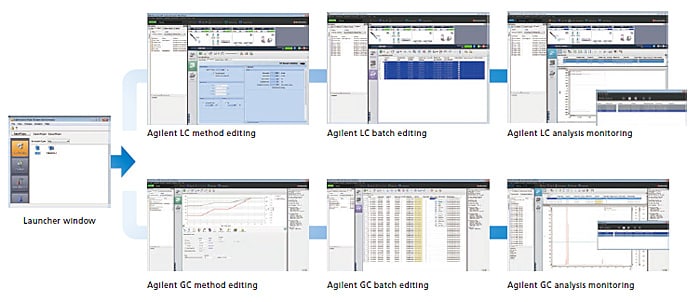
Simple User Interface
By selecting an Agilent instrument from the LabSolutions launcher window, the Agilent HPLC and GC control window can be displayed.The method editing, analysis batch editing, analysis monitoring, and system configuration windows are designed to integrate Agilent’s HPLC and GC in the best way into LabSolutions DB/CS.
The acquired data is integrally managed in LabSolutions CS, which provides a reliable network environment that complies with various standards through the LabSolutions security policy.
Compatible Instruments
Agilent HPLC 1100/1200/1260/1290 Series.
| Model Name | Model No. |
| Binary Pump | G1312B, G4220A |
| Quaternary Pump | G1311B, G4204A |
| High Performance Autosampler | G1367E, G4226A |
| Column Compartment SL Plus (oven) | G1316C |
| DAD (PDA detector) | G1315C, G4212A |
| VWD (UV/Vis detector) | G1314F |
Agilent GC 6890/7890/8860/8890 Series.
| Model Name | Model No. |
| GC Instruments | 6890 Series, 7890 Series, 8860 Series, 8890 Series |
| Autosampler | 7693 ALS |
| Headspace Sampler | 7697A, G1888 |
Note: The above table lists the main compatible models. For other compatible models, contact your local Shimadzu sales office or distributor.
Controlling Thermo's HPLC and GC
Thermo Fisher Scientific's LC and GC systems can now be controlled by LabSolutions DB/CS analytical data systems, which provide such functionality as integrated database management of analytical data and method information. In addition, LabSolutions CS provides integrated management of data from a variety of non-LC/GC instruments, including spectroscopic instruments, TOC analyzers, and balances, via the database on the server computer. This integrated data management of a wide range of laboratory instruments improves efficiency and supports the creation of reports on various tests. Integrated data processing for LC and GC instruments in LabSolutions DB/CS lessens the managing effort of analytical methods and user information due to the use of multiple analytical data systems and simplifies the learning process for operators. In addition, Shimadzu's proprietary functions, such as the report set function, which strengthens data integrity, can be used.
Network System for the LabSolutions™ CS Analytical Data System
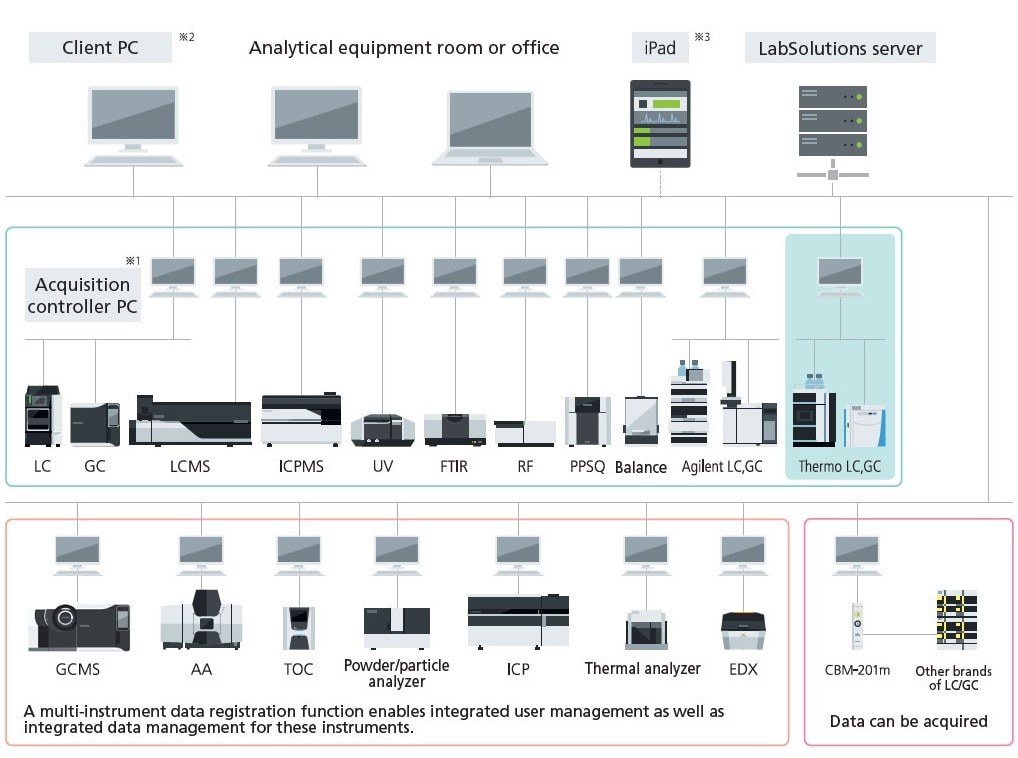
Note 1: The acquisition controller PC is used to control the analytical instruments.
Note 2: If a terminal service is used, the LabSolutions software does not need to be installed on the client PC.
Note 3: If an iPad is used, the Citrix XenApp must be installed.
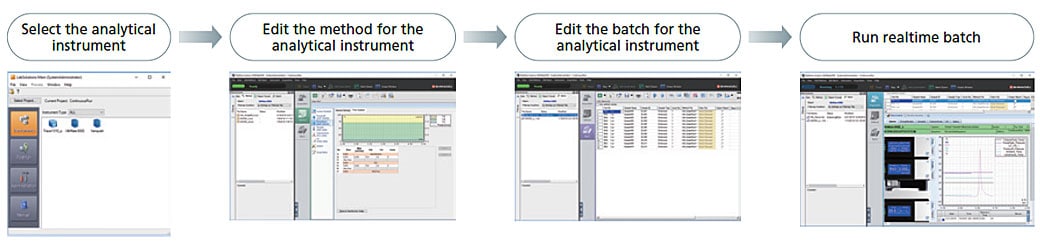
The control panel and method editor have been obtained from Thermo Scientific™ Chromeleon™ 7.2 CDS and integrated with other LabSolutions functions.
Thermo Fisher Scientific's analytical instruments can be operated with the same user interface (control panel, method editor) used with Chromeleon 7.2 CDS. The software also supports startup and shutdown functions. In addition, data analysis can be performed during acquisition using the snapshot function.
Proprietary LabSolutions functions can be used
Strengthened Data Integrity with Shimadzu's Proprietary Report Set
- Visualization of analysis operations reduces the burden of confirmation procedures and improves reliability.
- Tampering with the analytical results can be prevented by the system.
- Productivity can be enhanced by digitization of the analytical results reports.
Extended Calculations and High-Quality Report Creation Using Multi-Data Report
- High-level extended calculations can be executed in a secure environment.
- Minimizes transcription risks from manual entry, providing both labor savings and the creation of high-quality reports.
Expert Tools That Support a Variety of Data Analyses
- Highly precise peak detection can be performed using i-PeakFinder, a new peak integration algorithm.
- i-PDeA II, a deconvolution algorithm, enables innovative peak separation.
- The dynamic range can be extended using i-DReC, a unique data analysis function.
Applicable Models
| Thermo Fisher Scientific LC: | Thermo Scientific™ Vanquish™ UHPLC Systems Thermo Scientific™ UltiMate™ 3000 HPLC and UHPLC Systems |
| Thermo Fisher Scientific GC: | Thermo Scientific™ TRACE™ 1300 Gas Chromatograph Thermo Scientific™ TRACE™ 1310 Gas Chromatograph |
LabSolutions is a trademark of Shimadzu Corporation.
iPad is a trademark of Apple Inc, registered in the U.S. and other countries.
Thermo Scientific, Chromeleon, Vanquish, UltiMate 3000, TRACE 1300 and TRACE 1310 are trademarks of Thermo Fisher Scientific Inc.